Oh Sheet! Real world data engagement with Google Sheets

By Cindy Geldenhuys

"Technology's role in education shifts constantly -
from learning to use technology,
to using technology to learn,
to transformative learning with technology!”


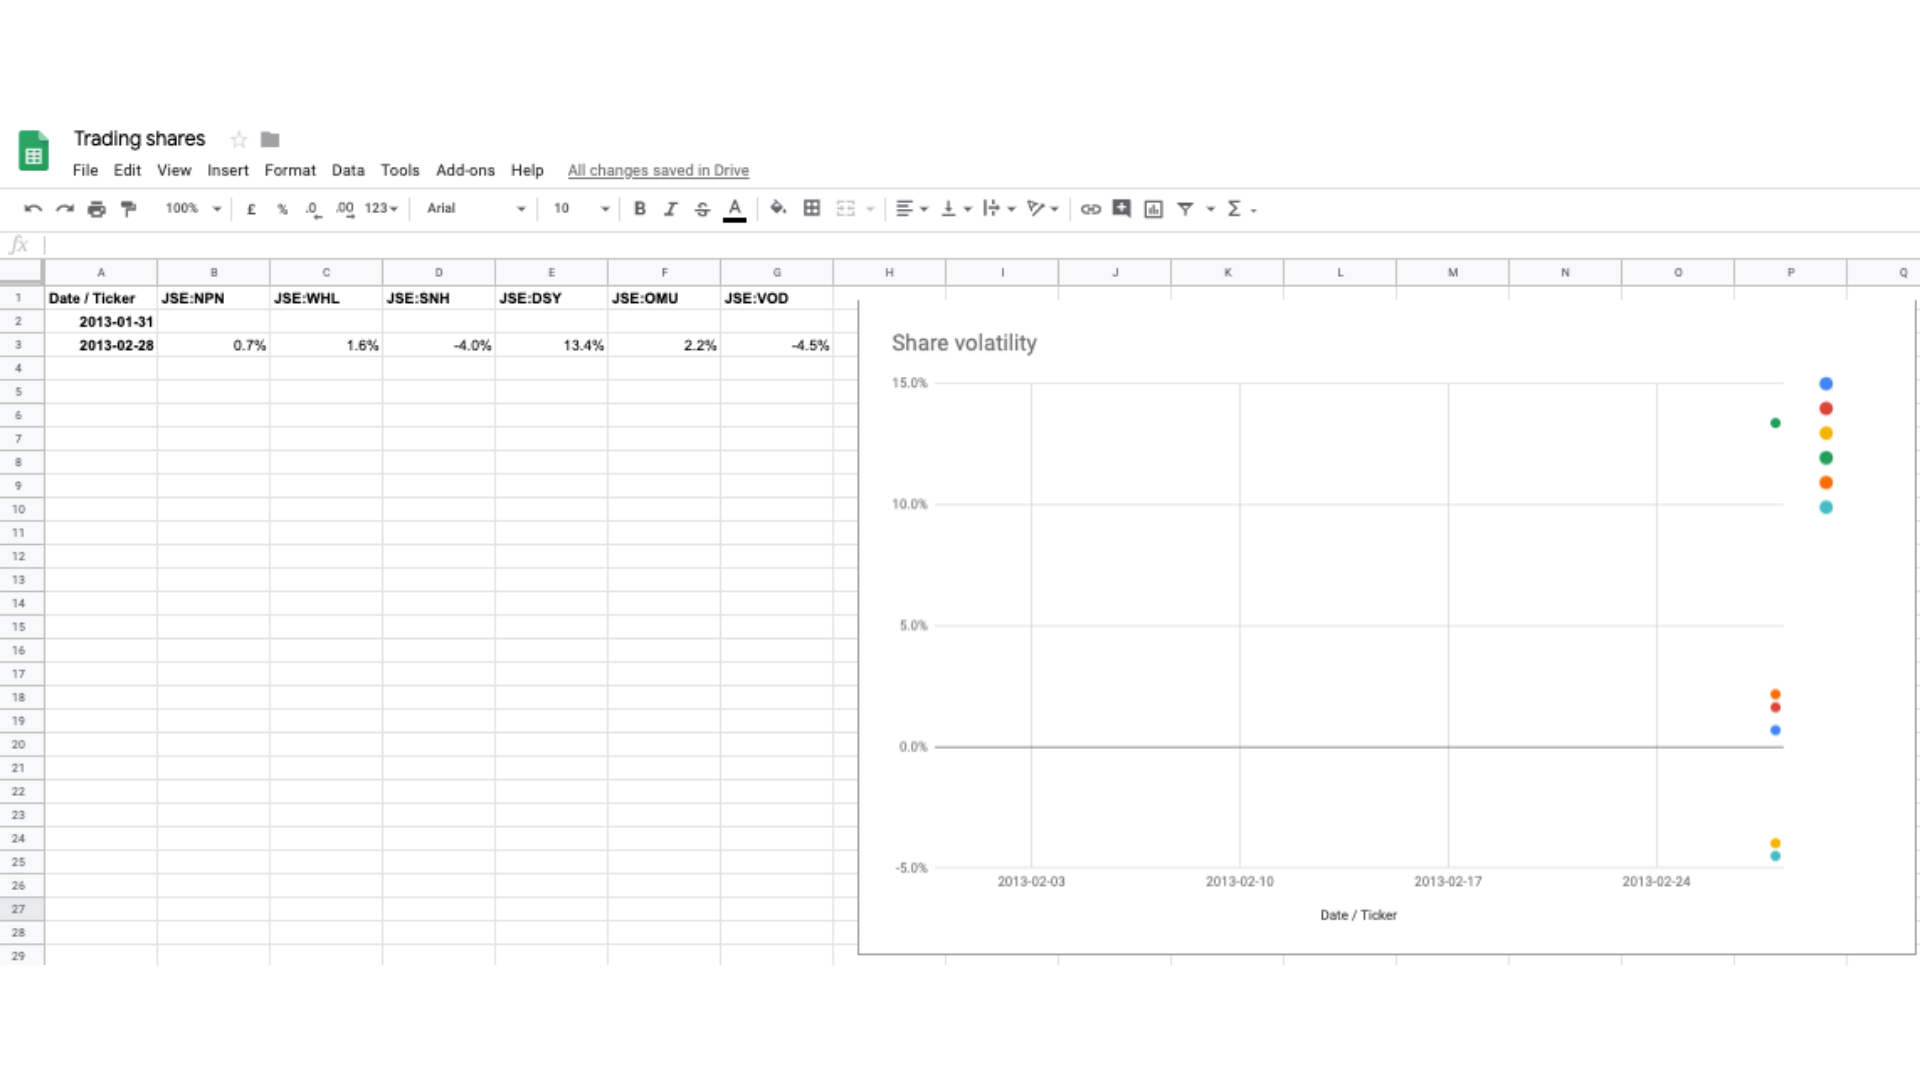
See how Cindy uses Google Sheets to teach spreadsheet and data analysis skills whilst engaging Grade 6s and 7s in solving real-world problems in her EMS lessons.

The vision

The vision

With this series of lessons I planned to teach the learners essential spreadsheet skills and data analysis skills, while applying these skills to a real world problem.

While trading mock shares on the JSE I aimed to teach the learners the following:

  • Basic spreadsheet functions - average, min, max
  • Spreadsheet keyboard shortcuts - Ctrl+A, Ctrl+Shift+arrow keys, etc.
  • Revise adding rows & columns, filtering & sorting
  • Conditional formatting
  • Spreadsheet formatting tips & tricks
  • Creating graphs
  • Finding trendlines
  • Referencing other cells
  • Referencing data on other sheets
  • Referencing data on other workbooks

Curriculum standards

The vision


This learning facilitated the development of the following skills identified in CAPS:

  • Students collect data or identify relevant data sets, use digital tools to analyse them, and represent data in various ways to facilitate problem-solving and decision-making.
Curriculum standards

Learning journey

The vision

DURATION: 4 x 50-minute lessons over 4 weeks and 2 terms for trading shares.

Student activities

The vision

PROJECT LAUNCH

Following the Grade 7 Entrepreneur's Week, we discussed other ways of making a profit and then we watched a video explaining how the Stock Exchange works. The boys were each given "R1000," and were told they had two terms to buy and sell mock shares. At the end of the second term we saw who had made the most profit. 

The aim was for each student to develop spreadsheet and data analysis skills while applying these in a way that is relevant and can be used in the real world. Each student was given a copy of the following Google Sheet. Grab your own copy below.

SPREADSHEET PREPARATION

I engaged in a discussion to revise the learners' prior spreadsheet knowledge. We discussed  terminology (cells, columns, rows) and shortcuts (ctrl a, ctrl shift arrow keys etc) and we revised how to insert rows and columns and how to filter and sort.

The following instructions were given to the students:

  1. Expand Column A in “Setup sheet” using the double click shortcut to make it wide enough to read the companies' names.
  2. Drag down the date in Column A in “SharesData sheet” until 2019-05-31.  Highlight Row 2 & 3 in Columns B-G and double click in the bottom right hand corner of cells to populate the data.
  3. Add conditional formatting. For Naspers and Steinhoff add Conditional formatting, colour scale, green to yellow to red where red is min value, yellow is midpoint and green is max value. For Old Mutual add Conditional formatting, single colour, if it is equal to or less than 30, red. For Vodacom add Conditional formatting, single colour, if it is equal to or more than 150, green. For Woolworths add Conditional formatting, single colour, custom formula =$C:$C=max(C:C). Discuss different uses for conditional formatting - to make it easier to see scale, to see outliers or to indicate only min, max and mid. Compare to Discovery with no conditional formatting.

DATA REPRESENTATION

The following instructions were given to the students:

  1. Using functions to determine the Average over period, Minimum value and Maximum value for each company in “SharesSummary sheet.”
  2. Create line charts for each company in “SharesCharts sheet.”
  3. Show them an example scatter plot with a trend-line in "SharesTrends sheet." Discuss advantages and disadvantages of using each type of graph.

DATA ANALYSIS

Facilitate a discussion around the conditional formatting, data summary and charts created. Ask students to predict which shares are going to increase and which are going to decrease in value based on the charts. Ask students whether they think it is better to buy and sell shares with a high risk but high possibility of reward, or to buy and sell shares with low risk but consistent, slow, steady growth. Ask students whether they think it is better to buy a few expensive shares or lots of cheaper shares.


Example of Naspers line chart


Examples of Steinhoff line chart

SHARE TRADING


The following instructions were given to the students:

You have R1000 to start with. Using the form, buy and sell shares over the next term. Base decisions of which shares to buy and sell on the data that has been analysed and trends that have been identified. Check the emails in your inbox to see what your bank balance is after each transaction. Keep track of the shares bought and sold using Google Sheets.

DISCUSSION & REFLECTION

At the end of the second term we announced which learner had made the most profit. We discussed which shares were the most successful shares to buy and how this could have been predicted by looking at the chart. Students were encouraged to reflect on what they would have done differently if they were given a second chance.

Student reflections

The vision
Student reflections

Technology used

The vision
  • Chromebooks
  • Google Sheets
  • Google Forms
Technology used

What's next?

The vision

I use this series of lessons to encourage the learners to use these skills to further explore real life challenges themselves, such as analyse data regarding unemployment, the literacy rate or climate change. In the following year the learners are expected to use these skills to draw up their own budget.

Closing thoughts

The vision

Using Google Apps Scripts is an extremely powerful tool and I would recommend that teachers start exploring this so that they can start tapping into this potential. This lesson would have been a logistical nightmare had I not made use of Google Apps Scripts and I am thankful that Google's tools allowed me to make this more manageable so that I had more time to focus on my key responsibilities - that of teaching and learning.


"The most dangerous phrase in the language is, 'We've always done it this way.'"

- Rear Admiral Grace Mary Hopper